History Trail will display a series of multi-colored icons representative of all of the locations on the map where the Asset was when the system received data points from the Asset. This will open in a new tab showing all events for the current day. You can customize the History Trail by adjusting the options in the drop down menus at the bottom of the page.
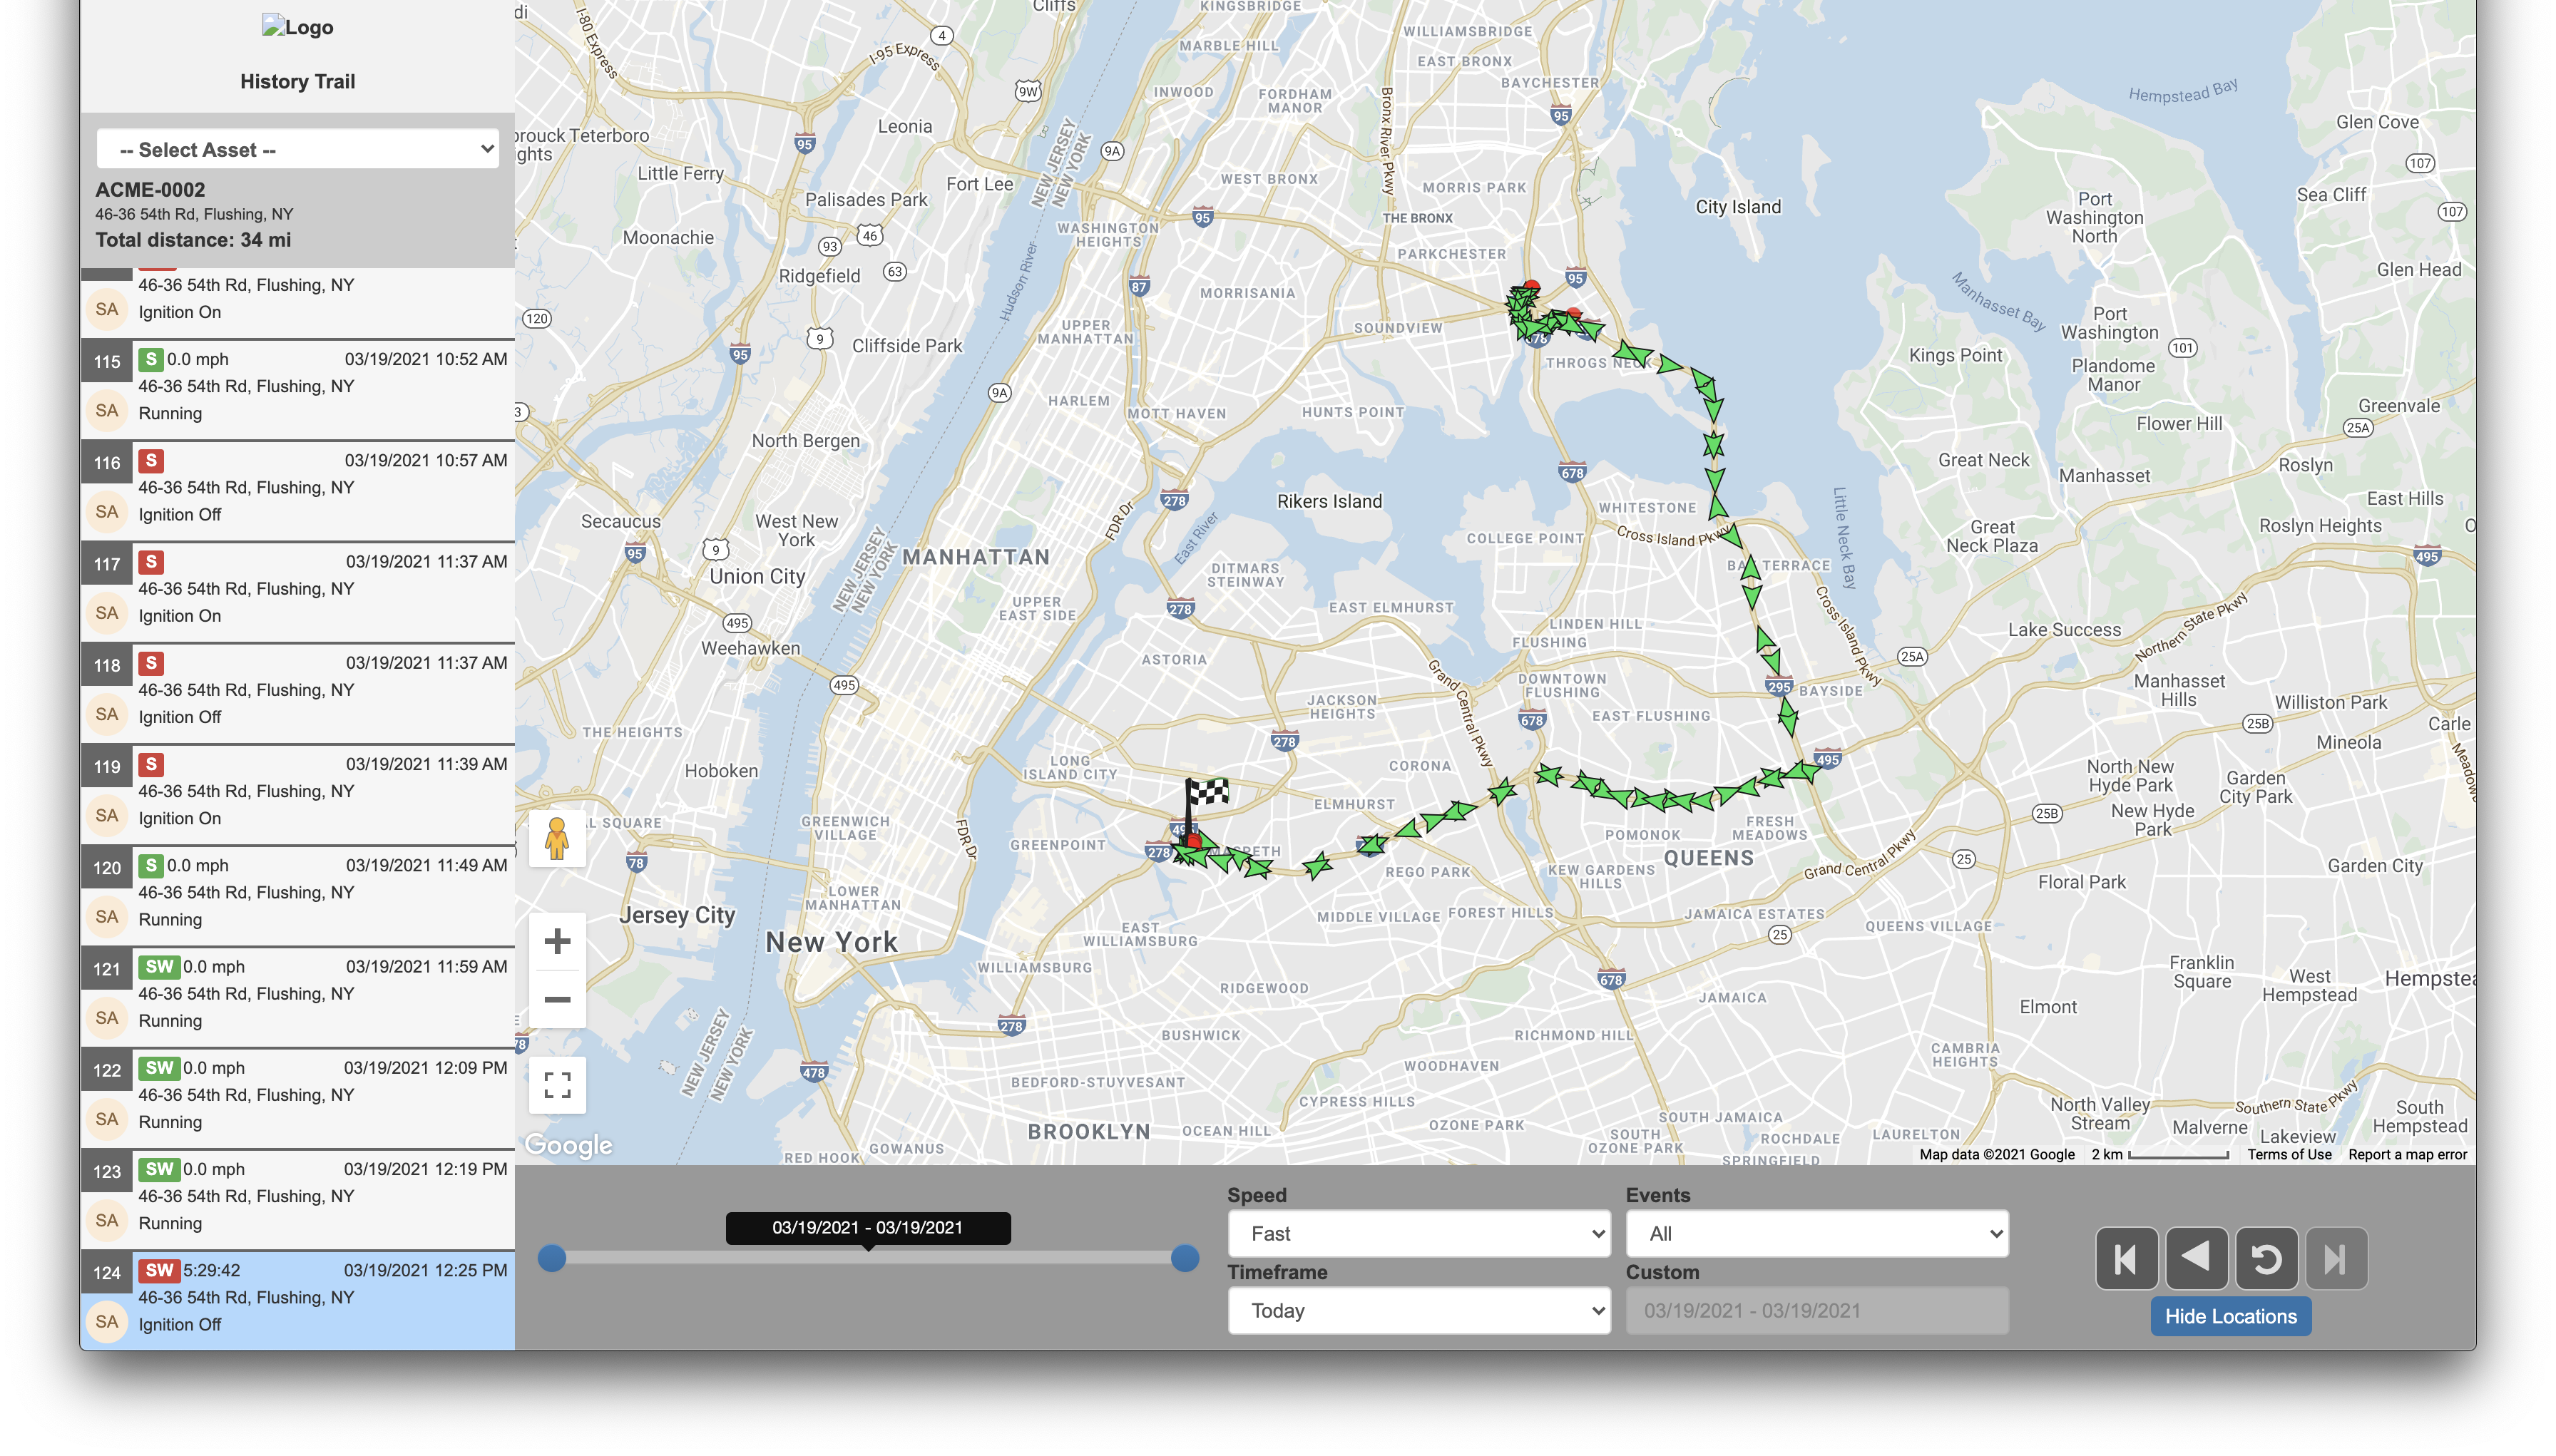
The list on the right side of the page will display each Event in a line-by-line sequence for the selected options of the History Trail.
The buttons on the bottom right allow you to play and rewind the History Trail to play a representation of the events that occurred in chronological order.
When the History Trail is played, a variety of icons will show each occurrence of movement and activity for an Asset for the time specified at the bottom. These different icons are described by the color-coded legend in the top left corner of the screen. Each instance can be selected to show additional information specific to that moment in the Asset’s History Trail. The system provides a marker represented by a green flag to indicate the initial position of the Asset at the start of the History Trail and a checkered flag to show the final destination of the Asset. All of these icons are used in combination to provide a visual diagram of your Asset’s activity. Icons are produced along the History Trail every minute and the time increment for receiving data can be set by the administrator per Asset.
The History Trail map view displays an overlay of any geofence Locations that an Asset stopped in during the time frame selected. Locations can be toggled on/off by clicking the Show/Hide Locations button.