Asset Dashboard will open a new window that shows extensive data elements about an Asset. This information is real time and will be automatically updated.
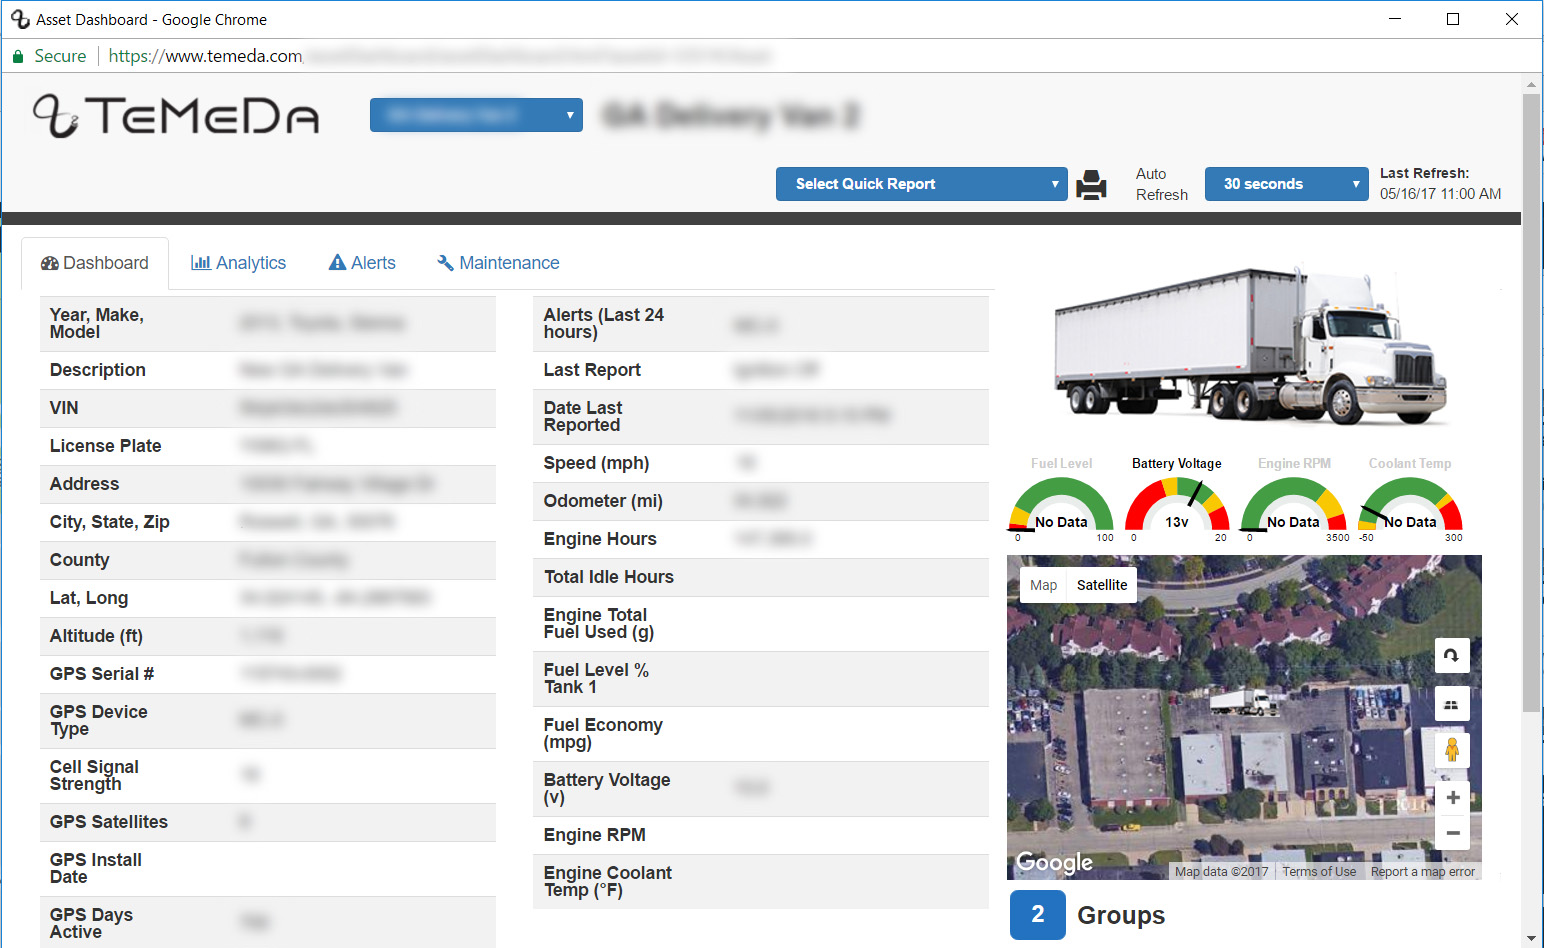
The Asset Dashboard gives you a simple way to see in-depth information about an Asset. Out of the box, you will see general detailed information such as Year, Make, Model, Description and VIN. You will also see information about the Asset’s Location, the current Alerts and diagnostic information.
On the right of the Asset Dashboard window you will see the Asset’s Icon and gauges showing Fuel Level, Battery Voltage, Engine RPM and Coolant Temp. You will also see a small map showing the Assets last reported location and any associated Groups or Projects.
At the top of the page there are drop down menus that allow you to change to a different Asset’s Dashboard or run a Quick Report for the current Asset. You can also specify the rate at which your screen refreshes the Dashboard for the current asset – manual, 10, 30, 60, or 120 seconds.
In the Asset Dashboard, there are tabs to view the Analytics, Alerts, and Maintenance for the selected Asset. The Analytics tab displays diagnostic graphs about the Asset. The Alerts tab displays detailed Alert information for all of the Alerts on the selected Asset. The Maintenance tab shows information about current, pending, and overdue maintenance tasks that need to be performed on this asset as well as previous maintenance that has been done.
The data elements displayed on the Asset Dashboard are customizable. If you’d like to change these elements, please contact OnTrak Solutions customer support at support@ontrak-solutions.com.